Geoscience Australia (GA) contributes to a greater understanding of natural hazard and disaster exposure through observations of water from space. This supports Australia’s capability to reduce the economic, social, and environmental impacts of flood events.
Historical Challenge: Australia’s Floods
With extreme vulnerability to flooding, the management of flood hazard is a key challenge for Australian communities, governments, insurers, planners, and industries. In financial terms, floods are one of the most damaging forms of natural hazard faced by Australia.
Historically, flood studies commissioned to understand exposure to floods have focused on populated areas, which in Australia are primarily located around the coast. This is unsurprising, as these areas have the greatest potential to sustain the highest damage in the shortest period of time. However, this left a significant information gap in understanding flood hazard, and surface water behaviour more generally, particularly in Australia’s extensive inland areas.
Satellite data are playing a key role in filling this gap, complementing flood studies and in-situ data to assist in decisions that can minimise loss of life, loss of property, and disruption to key economic sectors such as agriculture, mining, and energy.
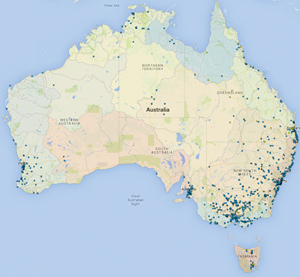
The Australian Flood Studies Database collates data from flood studies undertaken across Australia. This map shows the locations for which flood studies are available, and is an extract from the Australian Flood Risk Information Portal which links to the database.
Water Observations from Space
In 2011, the Australian Government commissioned the National Flood Risk Information Project (NFRIP) to increase the quality, availability, and accessibility of flood information across Australia. A key component of this project was the development of a water-observations product that capitalised on the unique capabilities of satellite observations to provide a consistent nationwide assessment of where surface water has been observed over previous decades.
WOfS was first released in 2014. Through this tool, GA has harnessed Earth observations from space, collected by the United States Geological Survey’s Landsat series, to develop the world’s first continent-wide map of the presence of water over a 25-year period at “paddock-scale”.
The information produced by WOfS provides an easily accessible summary of how frequently surface water has been observed over the continent between 1987 and the present day. It shows where bodies of water half a football field – or larger – have always been observed, such as the presence of permanent water bodies including lakes or dams; have occasionally been observed including flooding; or have never been observed.
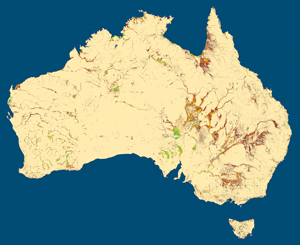
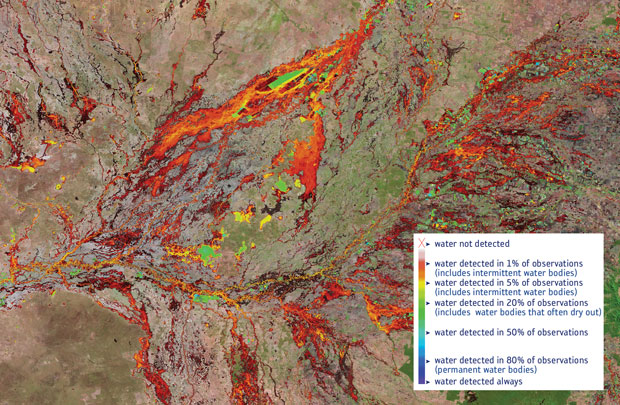
This WOfS summary product shows how often surface water has been observed. The colour scheme indicates frequently observed water (such as permanent lakes and dams) in purple and blue, down through greens to infrequently observed water (such as floods) in yellows, and finally to very low percentages in red.
In addition to providing this summary information, WOfS facilitates a better understanding of how water moves through the landscape over time. These insights are important, as the most appropriate mitigation approach for an area that is frequently inundated for short periods may be very different to the most appropriate approach for an area infrequently inundated for long periods.
A key feature and benefit of WOfS is the consistency and depth of data it provides. This requirement for data consistency and depth meant that WOfS was only economically viable through the use of satellite EO. The Landsat series was able to deliver consistent data across the very large Australian landmass, at regular intervals, at the decades-long time scales required for such a product. For a typical location, over 600 observations covering 27 years are used. For some locations, over 1000 observations are available.
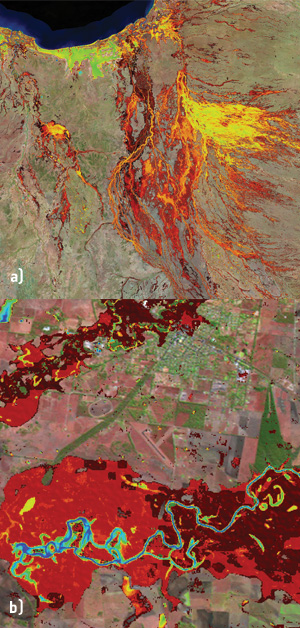
a) shows the northern Australian rivers flowing into the Gulf of Carpentaria, an important cattle-farming region. This is a broad, flat floodplain with flooding driven by the yearly wet season. The results for this region show large areas (in yellow) that are inundated regularly but also spend much time totally dry.
b) shows the area around the town of Chinchilla in southern Queensland, an important cropping region. The results here show that the neighbouring rivers are usually quite small (blue areas) but occasionally experience severe floods (in red) large enough to inundate the town itself.
Application of the Product
Although less densely populated, the inland areas of Australia are important. They are home to significant agricultural and resource industries; provide key rail and road transportation links to connect major economic centres; and house environmental assets, whose importance to communities and economic activity located considerable distances away is only just becoming apparent. The flat topography of these inland areas makes them particularly vulnerable to flooding, which can cover very large areas, take months to dissipate, and behave in less predictable patterns.
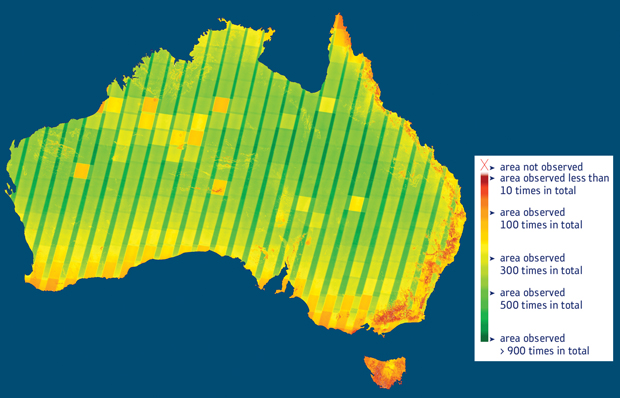
This figure shows how often Australia was clearly observed by the Landsat 5 and Landsat 7 satellites between 1987 and 2014. A clear observation is one where there has been no clouds, shadows, or data problems caused by sensor faults or steep terrain.
The WOfS tool provides planners, civil protection agencies, insurers, governments, and communities with a consistent set of data that can be used to support a range of disaster mitigation applications in these important areas.
For planners, the ability to understand how water behaves in these landscapes can support improved decision making around what to build and where. Such decisions can significantly reduce the duration and extent of direct flood impact and reduce flow on economic impacts. Improved decision making can also help mitigate infrastructure reconstruction costs, which are often borne by governments.
For civil protection agencies, understanding water behaviour in the landscape can inform response planning. Modelling when, and to what extent, communities may be isolated can enhance preparatory activities, particularly in coordination and prioritisation of logistics activities (such as movement of essential supplies) to homesteads or communities that may be isolated for long periods.
For insurers, the level of understanding provided through WOfS can assist in setting insurance premiums. While the availability of appropriately priced insurance products is important to both the insurers and the insured, it is also important to governments who desire a well-functioning insurance market as a way of reducing the reliance on government in the case of a disaster.
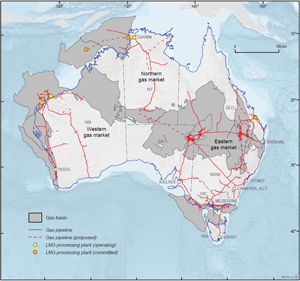
This map shows the location of major identified gas basins and infrastructure in Australia. Although significant gas activity occurs in offshore areas, significant inland deposits make understanding flood hazard in these areas important.
Image credit: GA and BREE, 2014, Australian Energy Resource Assessment, 2nd Ed. GA, Canberra.
For governments, keeping flood hazard at ‘top of mind’ is a key challenge. With its consistent, comparable and regularly updated quantitative data, WOfS offers a highly visual and intuitive tool for use in community education and outreach around flood hazards.
For communities, WOfS provides a freely available tool around which discussions can take place. Providing quantitative and up-to-date data can inform discussions and support decisions that can reduce exposure to risk.
In addition, the WOfS tool offers unique insights and data that may otherwise be unavailable. The consistent and quantitative nature of this product makes it a valuable tool to complement more targeted products, such as flood studies.
Making Satellite Imagery Work
Historically, satellite imagery has been difficult to use to its full potential, particularly over long time periods and very large areas, because of the large volumes of data. However, significant technical progress has been made and the technical barriers to making full use of EO from space are lowering. One example of these advances is the Australian Geoscience Data Cube, developed collaboratively by GA, CSIRO, and the National Computational Infrastructure, which underpins WOfS.
The Data Cube enables the full archive of Landsat data for the entire Australian continent to be analysed in a matter of hours, enabling this source of data to be used in a manner not previously possible. This new approach presents exciting opportunities for the application of EO from space to other aspects of DRR, such as mapping of fire history, where a consistent national understanding of hazard behaviour over long periods is critical.
Future of WOfS
Geoscience Australia will continue developing the WOfS, with future plans including incorporation of data from new satellites, such as the Europe’s Sentinel series, to provide an even richer product.
The WOfS technology has significant potential for transfer to other geographic areas, particularly developing countries with similar topography to Australia. As the product is based on the global Landsat dataset, technology transfer is simplified and it can also be adapted to local conditions with the potential for results to be shared with the international DRR community to create a global picture.
Both the WOfS tool and the Australian Geoscience Data Cube technology that underpins it are available as Open Source under Creative Commons licenses.
The Border Rivers area of northern New South Wales and Southern Queensland is one of Australia’s biggest and most important cotton farming areas. This figure shows how WOfS demonstrates the broad flooding that occurs in this region.
Case study contributors
Jonathon Ross, Norman Mueller, Adam Lewis (Geoscience Australia)
Further information
WOfS is accessible from the Geoscience Australia: www.ga.gov.au