Many already see food insecurity as the
single biggest threat facing humanity in the
21st century. There are many reasons for
this. The world population has just reached
7 billion, increasing at a rate of about 100
million per year, and is expected to reach
about 9.1 billion by 2050 according to
United Nations projections. In addition, per
capita demand for nutritional intake is
constantly increasing, especially in
developing countries, and it is estimated
that agricultural production will have to
almost double over the next 50 years
relative to 2010 levels to keep pace with
population growth and increasing nutritional
demands. On top of this, Intergovernmental
Panel for Climate Change climate models
predict future rises in atmospheric
temperatures and significant fluctuations in
precipitation over space and time, which is
expected to stress water resources severely,
causing further difficulties in feeding the
world.
The reality is that the ‘green revolution’
era (growing more food per unit of land) has
ended. After swift agriculture expansion in
the last 300 years (Figure 1), global
cropland areas have stagnated at
approximately 1.5 billion hectares, of which
roughly 1.1 billion hectares are rain-fed
and 400 million hectares are irrigated
(Figure 2). Cropland areas have begun to
decrease in some key agricultural producing
countries (e.g. USA) due to increasing
demand for fertile arable lands for
alternative uses such as bio-fuels,
encroachment from urbanisation and
industrialisation. Furthermore, ecological
and environmental imperatives such as
biodiversity conservation and atmospheric
carbon sequestration have put a cap on the
possible expansion of cropland areas to
other lands such as forests and rangelands.
On top of all this, irrigated areas that
were at the heart of the green revolution
era through rapid increases in their areas
and productivity have almost come to a
standstill as a result of limited water
resources.
In combination, these issues raise some
fundamental questions for today’s
decision-makers and society at large. How do
we ensure food security for the rapidly
growing human population without increasing
cropland area or water use (or with reduced
cropland area and water use)? The challenges
highlight the critical need to have a
comprehensive understanding of global
croplands and their water use that help
ensure global food security.
G20 Action Plan
In June 2011, G20 Agriculture Ministers met to
address the issue of food price volatility
with the ultimate objective of improving food
security prospects. They agreed on an Action
Plan on food price volatility and agriculture,
stressing the need to increase agricultural
production and productivity on a sustainable
basis. They noted this will require
“improvements in land and water management,
improved agricultural technologies, an
appropriate and enabling environment which
could lead to increased investments notably
from the private sector, well-functioning
markets and means to mitigate and manage risks
associated with excessive price volatility of
agricultural commodities”.
The G20 Action Plan has five main
objectives:
1. Improve agricultural production and
productivity both in the short and long term
in order to respond to a growing demand for
agricultural commodities.
2. Increase market information and
transparency in order to better anchor
expectations from governments and economic
operators.
3. Strengthen international policy
coordination in order to increase confidence
in international markets and to prevent and
respond to food market crises more
efficiently.
4. Improve and develop risk-management tools
for governments, firms and farmers in order to
build capacity to manage and mitigate the
risks associated with food price volatility,
in particular in the poorest countries.
5. Improve the functioning of agricultural
commodities’ derivatives markets.
Recognising the importance of timely, accurate
and transparent information in helping to
address food price volatility, and the need to
improve the quality, reliability, accuracy,
timeliness and comparability of data on
agricultural markets, the G20 Action Plan aims
to develop an Agricultural Market Information
System (AMIS). AMIS seeks to encourage major
players on the agri-food markets to share
data, enhance existing information systems,
promote greater shared understanding of food
price developments, and further policy
dialogue and cooperation. AMIS will involve
G20 countries in the early stage, inviting
other main grain and oilseeds producing,
exporting and importing countries,
representatives from major commodity exchange
markets and the private sector to participate.
Early efforts will focus on those market
players accounting for the greatest part of
world food production, consumption and trade.
AMIS will be housed at the Food and
Agriculture Organization of the UN with a
secretariat including other international
organisations.
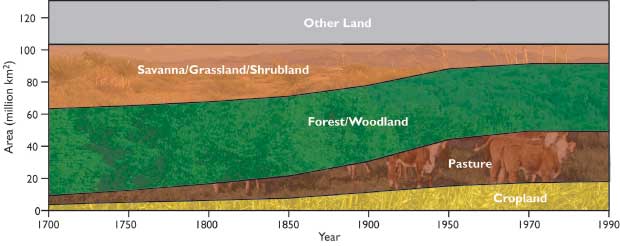
Figure 1. Changes in land cover during the
last 300 years due to agricultural
expansion. During the last 300 years there
has been a large increase in the amount of
land devoted to agriculture (croplands and
pastures) coming at the expense of natural
ecosystems. As human population and material
consumption continue to increase, the
pressure on our finite land base will also
continue to increase. (Data from the Center
for Sustainability and the Global
Environment, University of Wisconsin)
The Role for Satellite Earth
Observations
A diverse array of information is needed in
support of the kind of ambitions being pursued
by the G20 to contribute to global food
security, including (for example, Figure 3):
crop types, precise location of crops,
cropping intensities, cropping calendar, crop
health/vigour, watering methods (e.g.,
irrigated, supplemental irrigated, rain-fed),
flood security and drought information
including early warning and damage
assessments, water use assessments, crop
productivity, water productivity (productivity
per unit of water), agro-meteorological
information (e.g. precipitation, solar
radiation, land surface temperature, snow
cover and heat/cold wave), and terrain data
(slope or aspect of land). Advanced geospatial
information systems are needed to manage these
data and to develop a global view of
croplands, their productivity and their water
use in support of effective food security and
market pricing analyses. Data must be
consistent across nations and regions and must
be updated at a frequency consistent with the
derivation of information relevant to
different cropping cycles.
The global scale of this endeavour and the
need for it to be a sustained and operational
undertaking in support of our on-going food
security challenges are daunting, and would
simply be unachievable without the
capabilities provided by satellite Earth
observations. These observations are
fundamental in making complex agricultural
monitoring systems (such as AMIS) globally
consistent, repeatable and scalable. Important
advances and features of the data in this
context include:
− synoptic, wide-area coverage with global
reach;
− frequent temporal coverage and repeat for
coarse resolution sensors, complemented by
high-resolution data available less
frequently;
− well calibrated and stable measurements
allowing reproducibility of data across
different national and regional information
systems;
− free online access to key sensors, such as
Landsat and MODIS.
Achieving the necessary coverage and repeat
frequency of global croplands and the
multiple parameters of interest is an
extremely significant undertaking and will
require a fusion of data from multiple
satellites and coordination of satellite
assets of all countries, including those
operated by industry. Noting the scale and
complexity of the challenge, the Group on
Earth Observations has identified
agriculture as one of the societal benefit
areas which serve to focus its coordination
activities.
The recent political emphasis on food
security and food price volatility has put
the essential role of satellite Earth
observation firmly into the spotlight.
However, satellite Earth observation data
have long been used in this capacity and is
the basis for many existing crop estimation
systems. These include the United States
Department of Agriculture Foreign
Agricultural Service (FAS-USDA), and the
European Commission’s Monitoring Agriculture
with Remote Sensing (EC-MARS), which combine
weather data, in situ information and
satellite data to estimate production and
yield.
Several important global datasets and time
series have been employed to develop a
cropland history of the world going back to
1970s. These include: AVHRR GIMMS
(1981-2006), MODIS time-series
(2000-present) and Landsat Global Land
Survey (GLS) 30 m mosaics for the 1970s,
1980s, 1990s, 2000, 2005, and 2010.
Satellite datasets such as these are the
starting point for important global cropland
assessments, however, current best estimates
still feature significant uncertainties.
Sources of this uncertainty include
differences in national definitions, the use
of coarse resolution imagery that fails to
pick fragments of croplands, uncertainties
in sub-pixel estimates of areas, lack of
coordinated and systematic global ground
data collection, and a host of other issues.
In addition, intensity of cropping (e.g.,
single, double, triple, continuous cropping)
add to areas’ uncertainties. Global analyses
rely on a multitude of information inputs,
including many satellite-based sensors,
which means that significant coordination
efforts are required.
GEOGLAM
Recognising the fundamental role
for Earth observations as the
building blocks of AMIS, the G20 GEO
Global Agricultural Geo-Monitoring
Initiative (GEOGLAM) was launched in
2011. The initiative will be
coordinated by GEO through its
Agriculture Community of Practice.
GEOGLAM will focus on ensuring
availability of the necessary
observations, notably from satellite
systems, and will aim to reinforce
the international community’s
capacity to produce and disseminate
relevant, timely and accurate
forecasts of agricultural production
at national, regional and global
scales.
The first planning meeting of
GEOGLAM was held in Geneva in
September 2011 to start the process
of developing a detailed
implementation plan with core
partners. There were 13 G20 members
represented, along with CEOS, FAO
and WMO. Three actions were
identified as the focus for the
development of GEOGLAM in 2012 and
beyond:
Action 1: National capacities for
agricultural monitoring:
strengthening, capacity building,
experience sharing, research and a
focus on countries at risk.
Action 2: Global and regional
agricultural monitoring systems:
harmonising, connecting and
strengthening existing systems,
inter-comparing and disseminating
their information.
Action 3: Global Earth observation
system for agricultural monitoring:
developing an operational system,
coordinating satellite and in-situ
Earth observation and weather
forecasting.
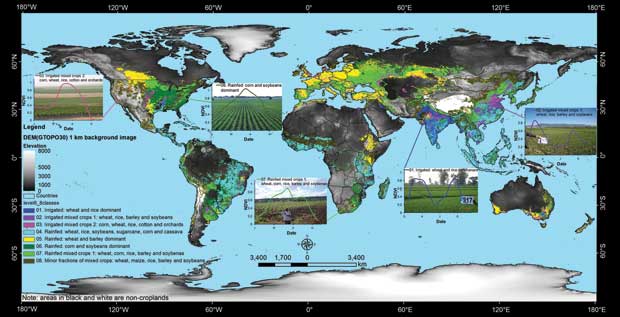
Figure 2. Spatial distribution of global
cropland areas of about 1.5 billion hectares
along with five dominant crops that occupy
60% of this area.
(Thenkabail and Gumma, 2012).
The Way Forward
The GEOGLAM initiative will focus community
attention on agricultural monitoring, seeking
to ensure that politicians and decision-makers
recognise the link between sustained satellite
observations and the availability of the
fundamental information required to support
food security strategies, including ambitious
programmes such as the G20’s proposed AMIS
system. The sheer volume of satellite data
involved will require extensive coordination
by all of the world’s civil space agencies,
probably supplemented with data from key
commercial systems. A number of CEOS member
agencies are working to develop an
understanding of the issues involved with this
coordination, and considering implementation
options.
It is also recognised that a number of
technical advances will be needed to meet
future needs:
− Higher spatial (30 m or better) and temporal
resolutions will be needed to support needs of
market information systems;
− Data fusion techniques must successfully
blend inputs from multiple sources, to
increase the richness of data and to
characterise crops better;
− Accurate automated cropland classification
algorithms are needed to scale up and
routinely and rapidly produce cropland area
statistics and crop productivity estimates.
Improved understanding of the biophysical and
biochemical properties of crops and their
productivity is anticipated from the use of
sensors with fine spectral resolutions.
Hyperspectral sensors will be used to develop
detailed spectral libraries of crops
throughout the growing season, and in
different agricultural regions around the
world. This in turn will lead to improved
satellite-derived crop classification and
classification accuracy. These improvements
will increase confidence in models of various
crop biophysical and biochemical parameters
such as biomass, leaf area index, yield, plant
water content and so on.
The study of plant life-cycle events and
how they are influenced by seasonal and
inter-annual variations in climate (cropland
phenology), cropping intensity and crop
calendars require time-series datasets
sustained over long periods. For example,
MODIS time-series have been combined with
detailed field plot data to help build the
history of agricultural development.
Continuing to build these datasets will
provide valuable information on changes in
land and water use.
Improved information on crop area and type
will help to inform improved cropland and
water use, contributing to food security.
Globally, humans use about 4000 km3 of
freshwater annually. Approximately 70% of
this is used for agriculture, with more than
half used by just four countries: India 684
km3; China 364 km3; USA 197 km3; and
Pakistan 172 km3. Agricultural water use
varies based on many factors, including the
extent of cultivated and irrigated areas,
intensity of cropping, climate, efficiency
of water use, crop types and
evapotranspiration of crops. In order to
better understand and optimise agricultural
water-use, accurate global croplands data
and water-use information products are
required, contributing to strategies to
produce more food sustainably.
Agro-meteorological factors such as
precipitation, solar radiation, land-surface
temperature and soil moisture heavily
influence vegetation growth, and are
imperative to predict crop yields (Figure
4). Global agricultural information systems
will require these parameters on multiple
scales, and with global coverage. Many of
the key data sources are provided by
operational meteorological satellite
programmes, coordinated under the auspices
of WMO. These satellite sensors enable
measurements of agro-meteorological
variables globally and uniformly with a
consistent revisit time. Meteorological
parameters are essential in forecasts of
future crop yields, and historical records
are also useful in determining relationships
between climatic factors and annual crop
yields. This kind of information will be
required for modelling the impact of
anticipated climatic changes on the yields
of different crop types and in support of
adaptation strategies in different countries
and regions.
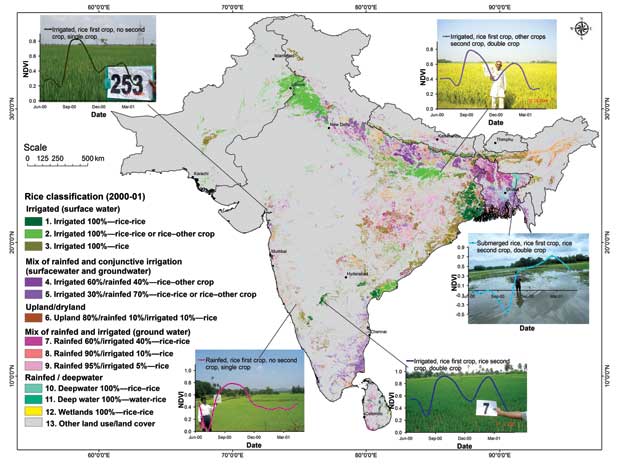
Figure 3. Crop phenologies and intensities
studied using time-series remotely sensed
data illustrated for rice crop in South
Asia. A clear and deep understanding of
phenologies and intensities will require us
to develop a temporal and spectral knowledge
base of each crop in different
agro-ecosystems of the world leading to
mapping of distinct classes within a crop
which in turn will lead to accurate
assessments of green water use (rain-fed
croplands) and blue water use (irrigated
croplands). (Adopted from Gumma et al.,
2011).
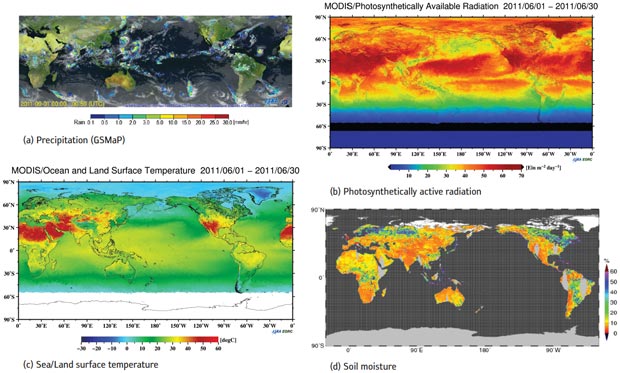
Figure 4. Examples of satellite-based
global agro-meteorological products showing
global hourly precipitation product (a),
namely Global Satellite Mapping of
Precipitation (GSMaP), derived from multiple
microwave and radar systems including TRMM
PR/TMI, Aqua AMSR-E, DMSP SSM/I (Kubota et
al, 2007). Photosynthetically active
radiation (b) and sea/land surface
temperature (c) are estimated from
Terra/Aqua MODIS (Frouin et al., 2007,
Saigusa et al., 2010), and soil moisture (d)
is estimated from AMSR-E (Fujii et al.
2009).